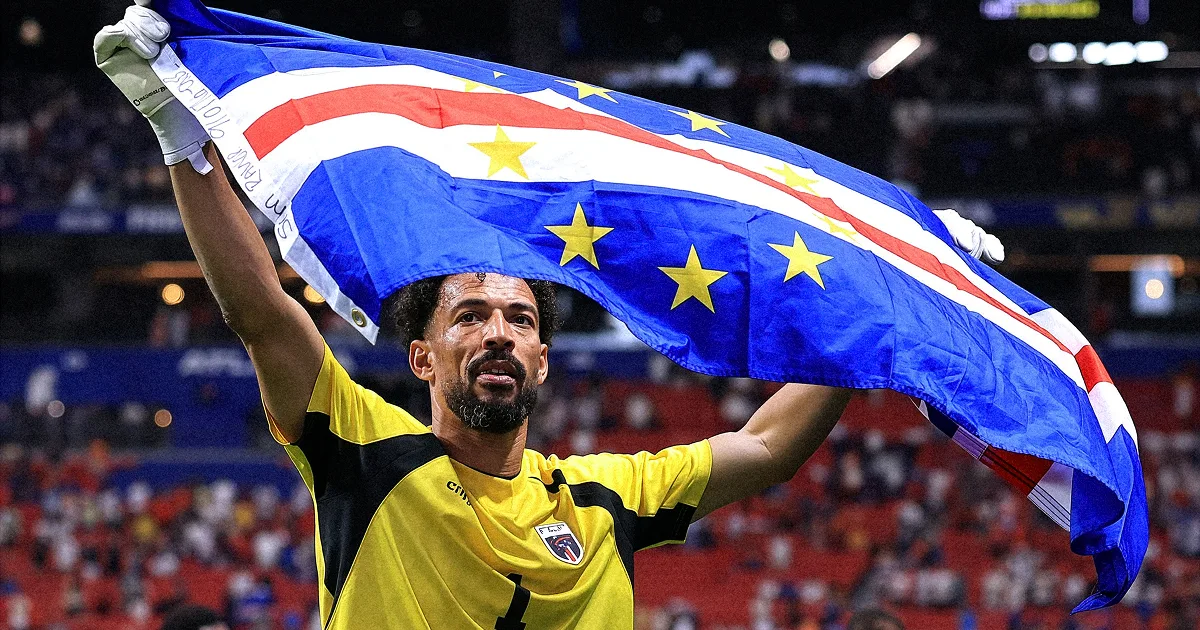
Players, memes and emotion shaped the 2026 World Cup on social
An analysis of more than 2,000 Instagram posts reveals why first-person access, emotional moments and participatory ideas consistently broke through.
The matches created the moments. Players made them personal. Social gave football culture a place to recognise, process, carry and participate in the tournament.
The biggest posts were not united by one format or outcome. Some concentrated attention around a player. Some helped audiences process victory or defeat. Others carried a result across social or gave supporters a gesture, joke or ritual they could repeat.
The strongest content brought together three things:
- A meaningful sporting moment
- A credible point of view
- A social behaviour audiences could take part in
Emotion made results matter beyond the score
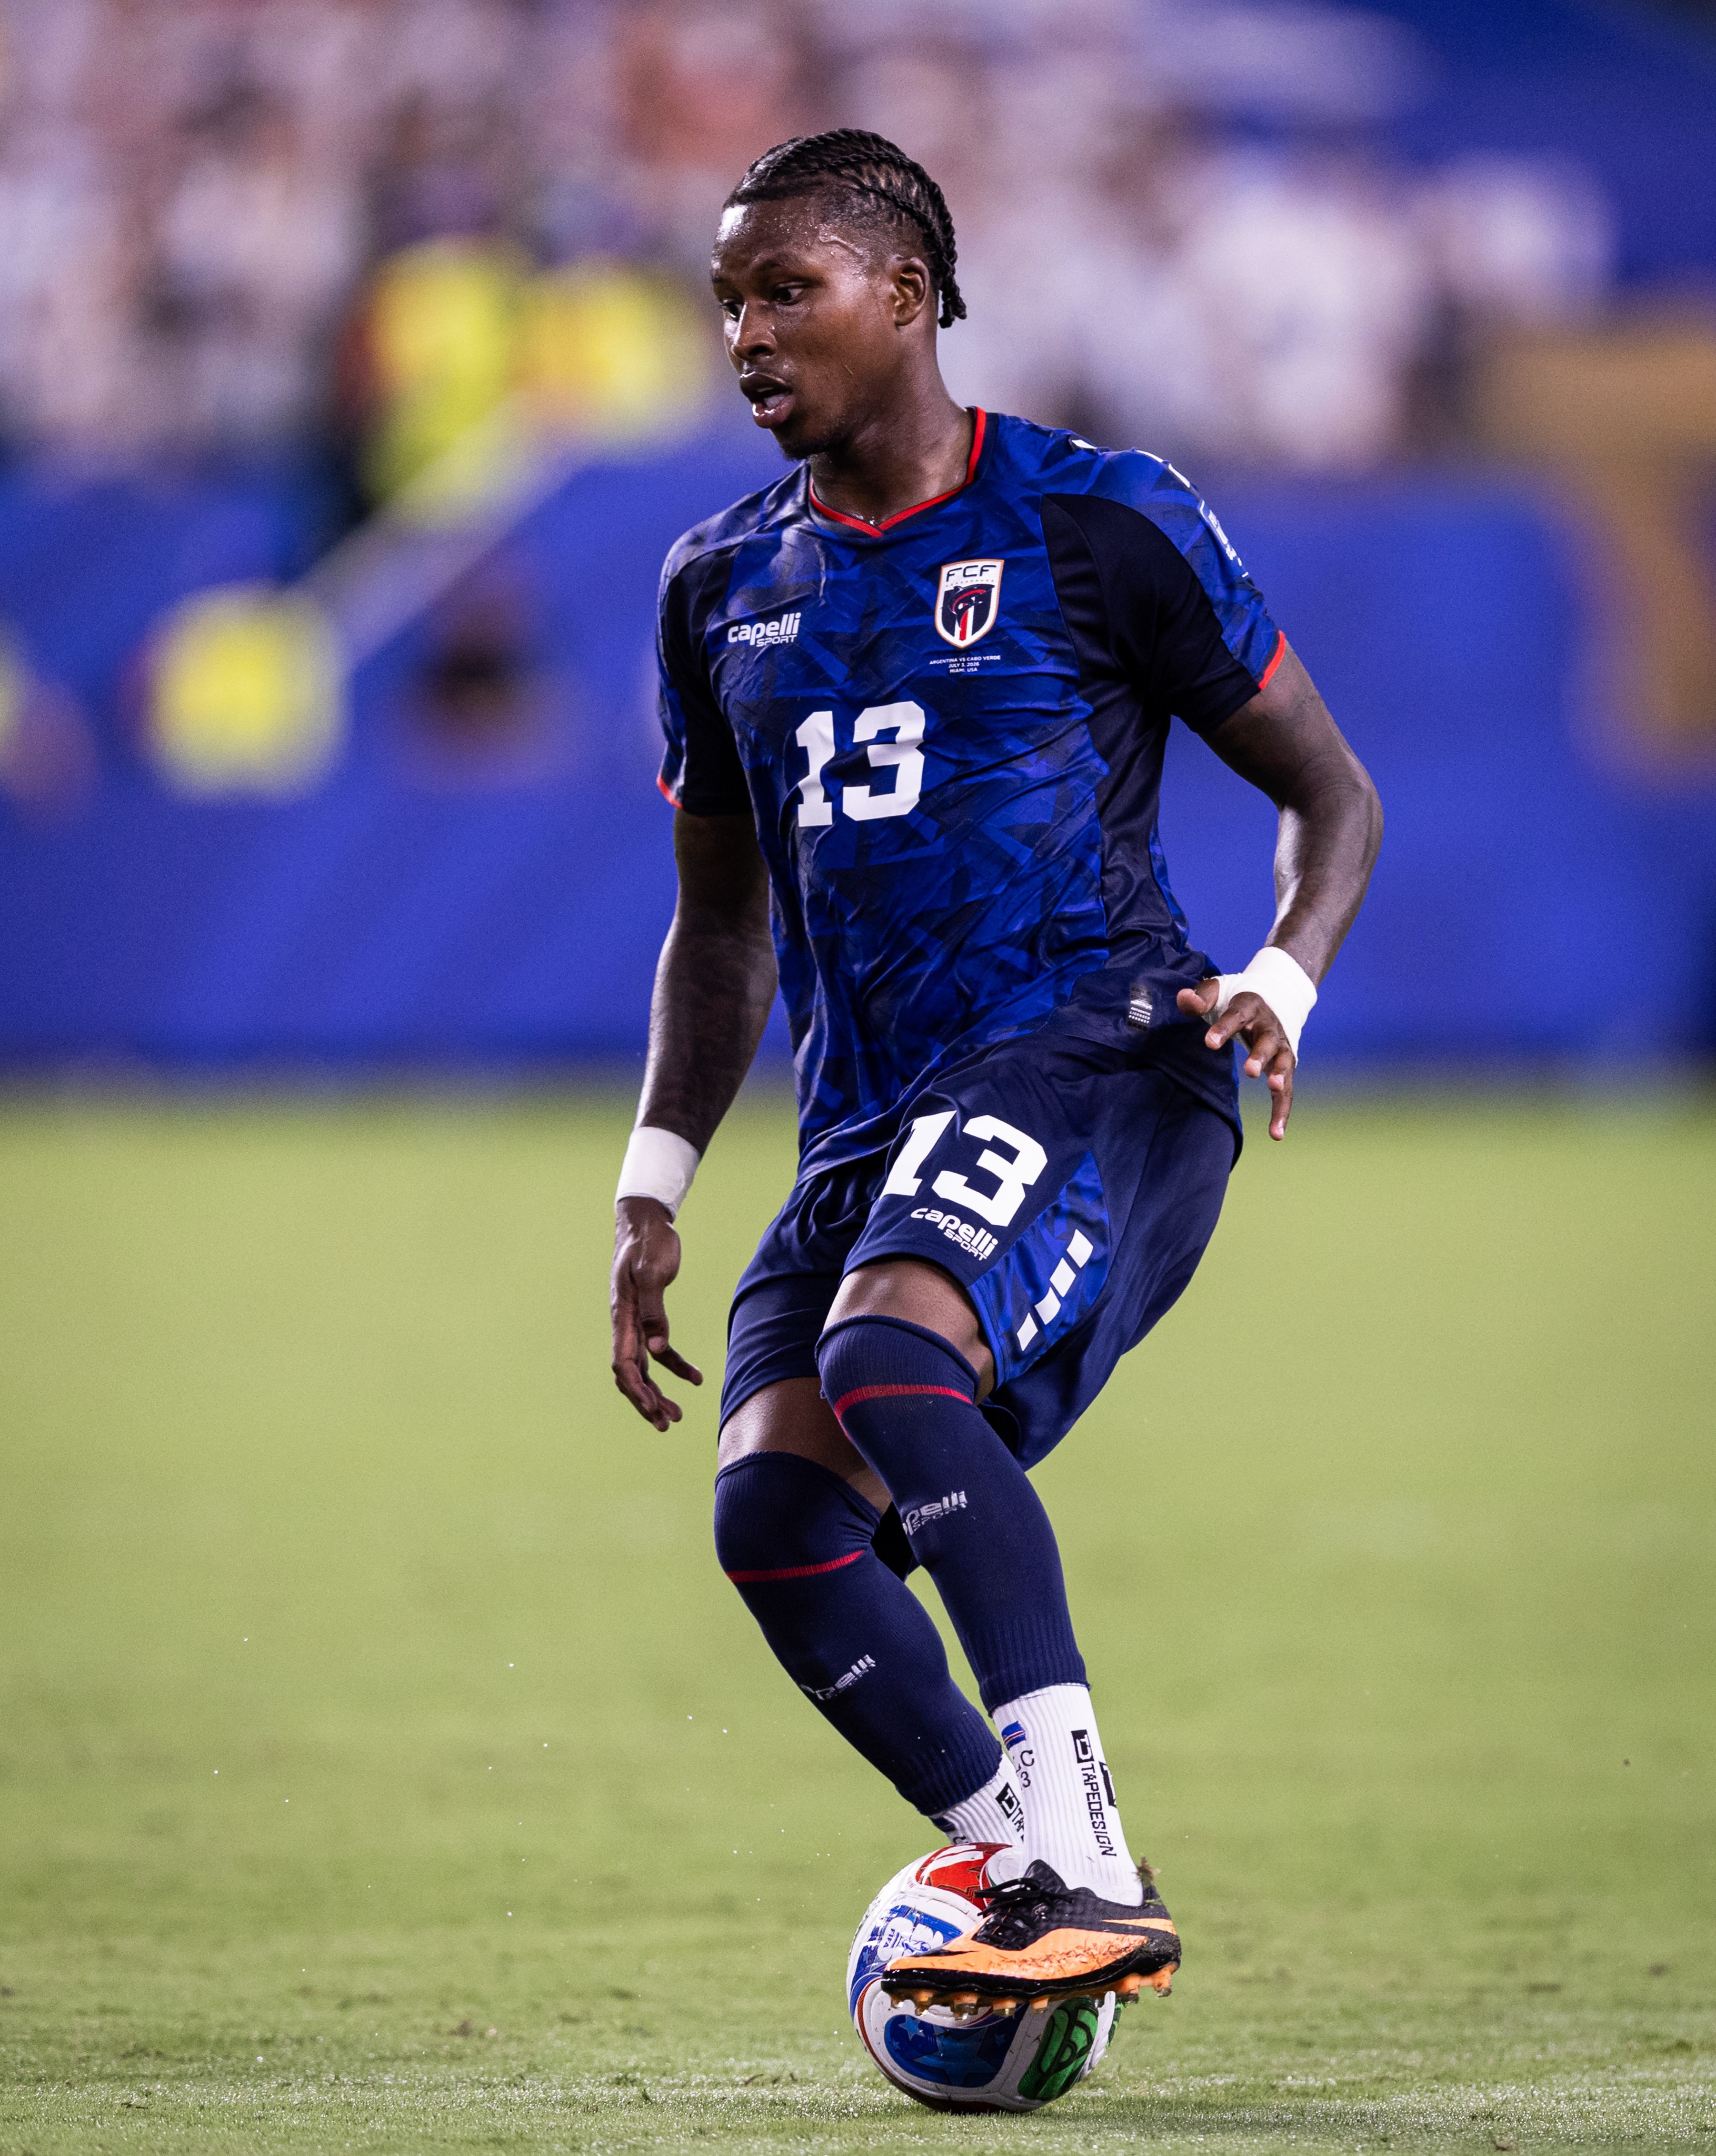
On 3 July, Cape Verde fell behind against Argentina for the second time.
In the 103rd minute, Sidny Lopes curled in an equaliser, keeping the possibility of a historic upset alive. Argentina eventually won 3-2.
The following day, Sidny wrote one line to approximately one million followers: “1% di oportunidade, 99% di fé.” One percent opportunity. Ninety-nine percent faith.
The carousel opened with Sidny in match action, then moved through Messi, an embrace in the stands and a caption written first in Kriolu, then in English.
It did not reduce the match to a result. It assembled the evidence of having belonged.
The post generated 5.5M engagements, 127 times the expected response for an account of its size. It was the strongest size-adjusted result Phainos measured during the tournament.
But it generated only 1 share for every 100 likes.
This was not primarily a post for distributing information. It became a place where recognition and emotion gathered around a player.
The match produced the attention. The farewell gave it somewhere to go.
The same pattern appeared across the wider dataset.
Victory celebrations entered the tournament’s top-performing set 1.8 times more often than their publishing volume predicted. Defeat and elimination posts did so 2.0 times more often.
The result did not need to be positive to create relevance.
Elimination posts also generated 1.7 times as many comments per like as victory posts. Victory concentrated total engagement. Defeat moved more of the response into conversation.
Communication should not stop at elimination. Some of the strongest opportunities for connection appear while players and supporters are still processing what happened.
Memes were rare. Breakthroughs were not.
Phainos compared each content category’s share of overall publishing with its share of the tournament’s biggest posts.
Memes produced the clearest advantage.
They represented just 2.2% of World Cup content but 7.4% of the biggest posts. A meme was therefore 3.4 times more likely to break through than its publishing volume suggested.
Behind-the-scenes content followed. It accounted for 6.9% of publishing and 14.1% of the top set, a breakthrough rate twice as high as expected.
Defeat, elimination and victory celebrations also consistently over-indexed.
| Content type | Share of all posts | Share of top posts | Likelihood of breaking through |
|---|---|---|---|
| Meme | 2.2% | 7.4% | 3.4× |
| Behind the scenes | 6.9% | 14.1% | 2.0× |
| Defeat or elimination | 4.2% | 8.5% | 2.0× |
| Victory celebration | 12.1% | 21.9% | 1.8× |
| Training | 7.3% | 7.0% | 1.0× |
| Brand or sponsor | 6.6% | 5.6% | 0.8× |
| Match action | 16.7% | 13.3% | 0.8× |
| Retrospective or tribute | 8.8% | 5.2% | 0.6× |
| Fans or crowd | 6.9% | 3.0% | 0.4× |
| Media duty | 14.4% | 5.2% | 0.4× |
| Matchday ritual | 11.9% | 2.6% | 0.2× |
At the other end of the table, matchday rituals and media duties represented 26% of everything published but only 8% of the biggest posts.
Arrivals, lineup graphics, press conferences and sponsor appearances kept the tournament covered.
They rarely defined it.
That does not make scheduled content unnecessary. Tournament communication still requires information, consistency and commercial delivery.
But coverage and breakthrough content serve different roles.
A matchday graphic can fulfil an operational need without becoming culturally significant. A player reaction, meme or behind-the-scenes moment can create relevance through immediacy rather than production value.
The mistake is expecting both to perform in the same way.
Players published 17% of the content and produced 45% of the breakthroughs
Publisher type changed the odds as clearly as content category.
Players created 16.9% of the World Cup content in the dataset but accounted for 45.2% of its biggest posts.
Teams and federations created 33.7% of all content but accounted for only 10.7% of the top-performing set.
| Publisher | Share of all posts | Share of top posts | Likelihood of breaking through |
|---|---|---|---|
| Player | 16.9% | 45.2% | 2.7× |
| Media | 46.5% | 42.2% | 0.9× |
| Brand | 2.8% | 1.9% | 0.7× |
| Team or federation | 33.7% | 10.7% | 0.3× |
Players were 2.7 times more likely to enter the top set than their share of publishing suggested.
The advantage came from proximity.
Player accounts sat closest to the emotion, first-person access and cultural response surrounding each match. Institutional accounts carried more of the tournament’s scheduled obligations: match information, sponsor commitments, media duties and formal coverage.
A federation can document a changing room. A player can show what the moment meant from inside it.
A team can publish a result. A player can make the result personal.
The role of the content operation is therefore not to centralise every story on the largest institutional channel. It is to identify who has the most credible relationship to the moment and give that person the access, support and freedom to respond.
Likes rewarded recognition. Shares revealed what travelled.
The tournament’s most-liked and most-shared posts were not the same.
Only 3 of the ten most-shared World Cup posts also ranked among the ten most-liked.
The clearest example was FIFA’s Spain champions graphic.
It led the share ranking with 2.9M shares but ranked 66th by likes. The post generated 43 shares for every 100 likes.
The image brought the team, trophy and result into one frame. It functioned as an official result card: a simple way for supporters to carry the news into their own communities.
Sharing was also highly concentrated.
Just 32 posts, 12% of the top set with available share data, generated half of all shares.
Memes showed the strongest tendency to travel relative to the recognition they received. The typical meme generated 15 shares for every 100 likes, compared with 3 across the wider top set.
Sidny Lopes’s farewell, Spain’s champions graphic and the tournament’s meme content were all successful, but they performed different functions:
- Sidny’s post concentrated recognition around a player.
- Spain’s graphic carried a result.
- Memes circulated as shared cultural references.
A single engagement total hides those differences.
Not every post needs to do everything. It needs one clear job and a metric capable of proving whether that job was achieved.
| Content objective | Audience behaviour | Primary signals |
|---|---|---|
| Build relevance around a player | Recognise | Likes, follows, size-adjusted engagement |
| Deepen emotional connection | Process | Comments, sentiment, saves |
| Distribute a result or message | Carry | Shares, reposts |
| Enter football culture | Participate | Remakes, UGC, meme spread |
| Maximise exposure | Reach | Views, reach |
The strongest ideas paired the right voice with something people could repeat
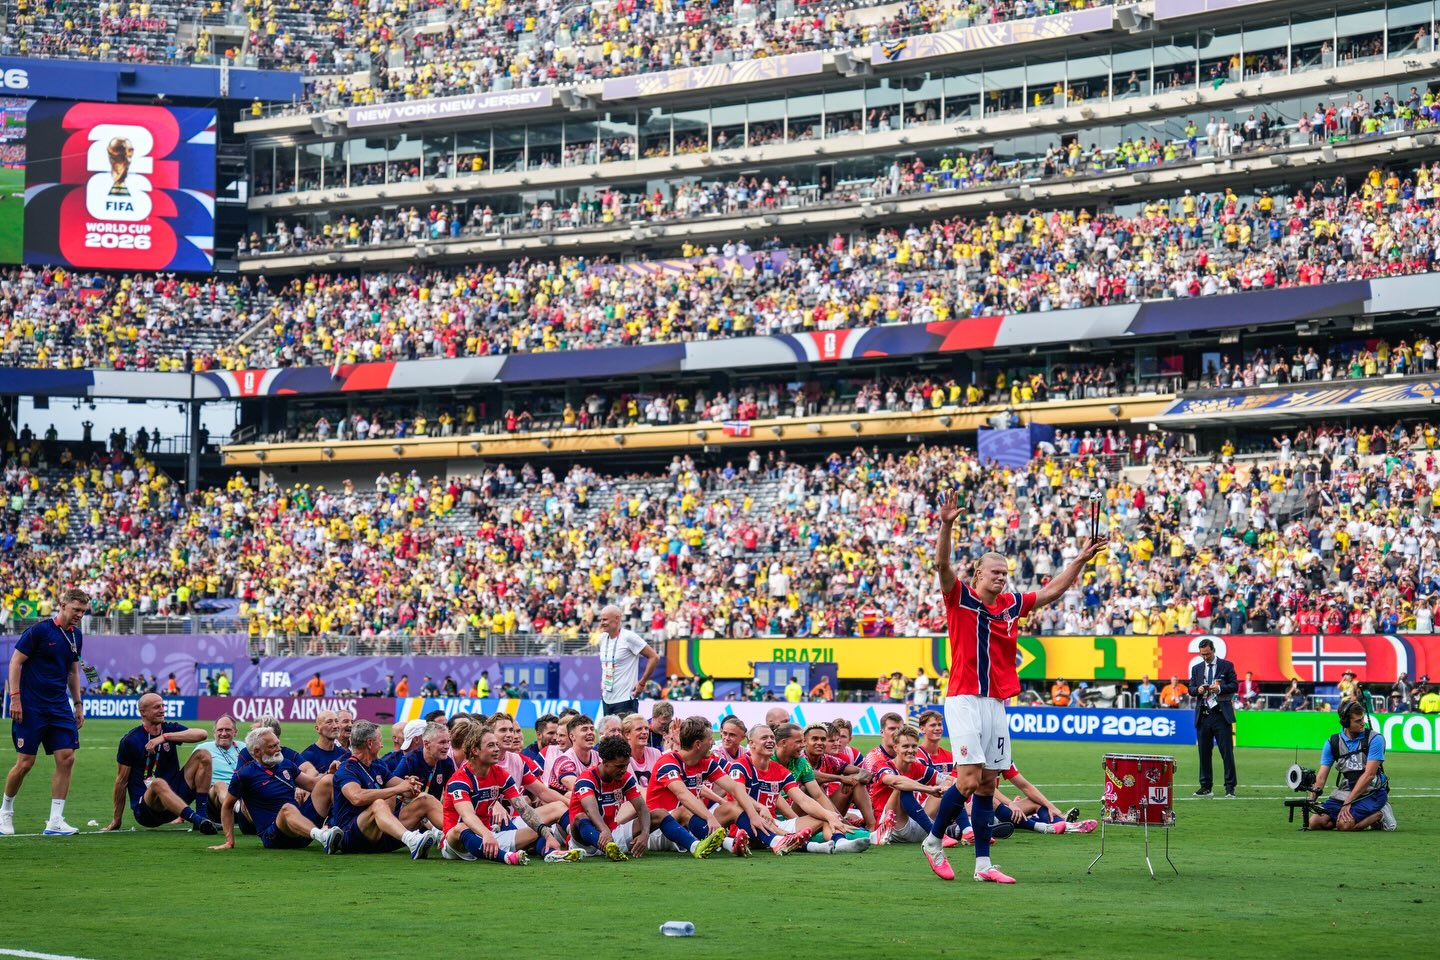
After Norway beat Brazil 2-1 on 5 July, the squad sat in a line on the pitch and mimed rowing to a drumbeat.
The following day, the Norwegian federation published the celebration as a collaboration with Erling Haaland.
The federation had approximately 1.1M followers. The collaboration reached 150.7M views.
Haaland supplied distribution. The row supplied the idea.
Norway returned to the same visual code across 4 posts. The repeatable unit was not the footage, camera angle or edit. It was the gesture itself.
FIFA later documented versions in schools, parliament, public parks and Times Square.
By then, the row no longer depended on the original post. It had become something supporters could perform themselves.
The same principle shaped the tournament’s most-viewed World Cup post.
Creator @celine.dept published it in collaboration with Portugal. The reel showed her meeting Cristiano Ronaldo, the player who had inspired her to play football, work hard and believe in herself.
It generated 253.2M views.
Celine was not simply a creator with access to a superstar. She had already built a football audience around player encounters and a recurring handshake.
With Ronaldo, that format carried a personal history.
Portugal provided access and distribution. Celine provided the perspective that made the meeting meaningful.
The strongest collaborations did not simply combine follower counts. Each participant added something different:
- Federations and brands: access, infrastructure and coordination
- Players: identity, emotion and credibility
- Creators: perspective, format and cultural fluency
- Media accounts: framing and distribution
The best social ideas also gave the audience something to carry forward: a gesture, phrase, visual treatment, recurring format, ritual or joke.
They were not complete when published. They left room for people to repeat, reinterpret or extend them.
This article works from the top of each ranking. Every World Cup post behind it sits in the interactive table, sortable by views, engagement, shares, reposts and saves, and filterable by format, segment and category.
Takeaways
What brands and marketers can learn
1. Become a social-first collaborator
The strongest tournament content emerged when players, creators and institutional accounts contributed different strengths.
Brands can provide access, production support, media investment and distribution. Players and creators provide the perspective and cultural fluency that make the content matter.
A social-first collaborator does not begin by asking how the brand can appear. It asks what the moment needs and who is best placed to tell the story.
2. Embrace football culture rather than borrowing its codes
Memes, gestures, rituals and inside jokes performed because audiences already understood and participated in them.
Brands cannot enter football culture by applying its visual language after the fact. They need to understand how supporters communicate, what they repeat and which moments carry meaning beyond the result.
That means listening before publishing and responding while the conversation is still alive.
3. Give players and creators a platform to land
Players produced 17% of World Cup content but accounted for 45% of its biggest posts.
Brands should treat players and creators as publishers, not only as talent appearing in branded assets.
Give them access, fast approvals, production support and distribution. Then allow their own voice, format and relationship with the community to shape the story.
4. Engage with the community, not only the audience
Football audiences do not simply consume content. They reinterpret it, share it, imitate it and turn it into collective memory.
Brands should create room for those behaviours. Build ideas supporters can carry forward, then engage with what the community creates in return.
The brands that matter in football culture will not always be those that speak the loudest.
They will be the ones that help the right voices land, participate credibly in the conversation and give the community something worth carrying forward.
Methodology. Phainos tracked the public Instagram accounts of 1,302 World Cup participants between 11 June and 19 July 2026. We classified a seeded random sample of 2,116 posts and a top set of 306 posts by World Cup relevance and content category; 36 unrelated posts were excluded. Lift compares each category’s share of the top set with its share of the random sample. Engagement is the latest observed likes plus comments. View rankings cover video only, and Stories are excluded. Share analysis uses a fresh 23 July collection for 268 of the 270 World Cup-related posts in the top set. Shares and reposts are treated as separate actions. Share category figures use the reconciled classification collected with the share snapshot. Posts were captured at different stages of their engagement lifecycle, so totals describe the observed ranking on 23 July rather than like-for-like performance after a fixed number of days. Size-adjusted results use the relationship between follower count and typical engagement across 486 accounts, measured with the follower count nearest publication. Collaborations are scored against every measured credited audience; posts with incomplete audience data are omitted from size-adjusted rankings. Content-case descriptions were manually checked against the stored media and captions.
More World Cup 2026 Articles
Which brand won the World Cup on Instagram?
Ten players captured almost half of all Instagram follower growth at the 2026 World Cup
The World Cup leaderboard missed four bigger stories